Easygari a service that takes care of you car and its occupant.
Easygari UX like all the coming digital products are based on 4 UX principles:
Simplicity
Highly visual
Personalized
Inclusion
First of its kind in Telenor, the idea is to foray onto the connected car market and create a Pan-Asian (Telenor is present in 5 countries in Asia) mobility platform to our partners and developers
There is a lot of hype on IoT recently but what is in substance?
For the last years I came up with this simple definition:
def: IoT is the ability of objects to speak and respond.
Think of toy story or cars (my son favourite) Pixar movies where toy and car items interact. Yes you get it, it is as simple.
Well, you got the concept.
Now you might wonder how big is this?
According to IDC and Gartner, IoT is not big, it is massive. IDC estimates IoT spending in 2016 at $737 billion. The research institute forecasts IoT spending to grow by 15,6% on an annual basis for the next 5 years to reach $1.29 trillion in 2020, that is the size on todays’ Australian economy!
In terms of number of devices, Gartner predicts 6.4 Billion IoT objects in 2016, that is roughly the size of global population.
As a summary here, IoT value is equal to the size of the Netherland economy and there is 1 IoT devices per human on earth.
IoT market value = The Netherland GDP, 2016
1 IoT device = 1 human on earth
Why now and why so fast?
Well, basically there is a concordance of 4 phenomenas that explains IoT exponential growth:
the Moore law
the Nielsen law
the Metclaff law
Marshall Law
Those laws are not recent, some dated from 18th century, actually pretty old, but there is old saying that says, “good food is always made of old pans ” ,isn’t it?
Let me explain the 4 laws briefly:
The Moore law states that “the number of transistors in a dense integrated circuit doubles approximately by 18 months” that means the computing power (i.e. chips and memory) doubles every 18 months.
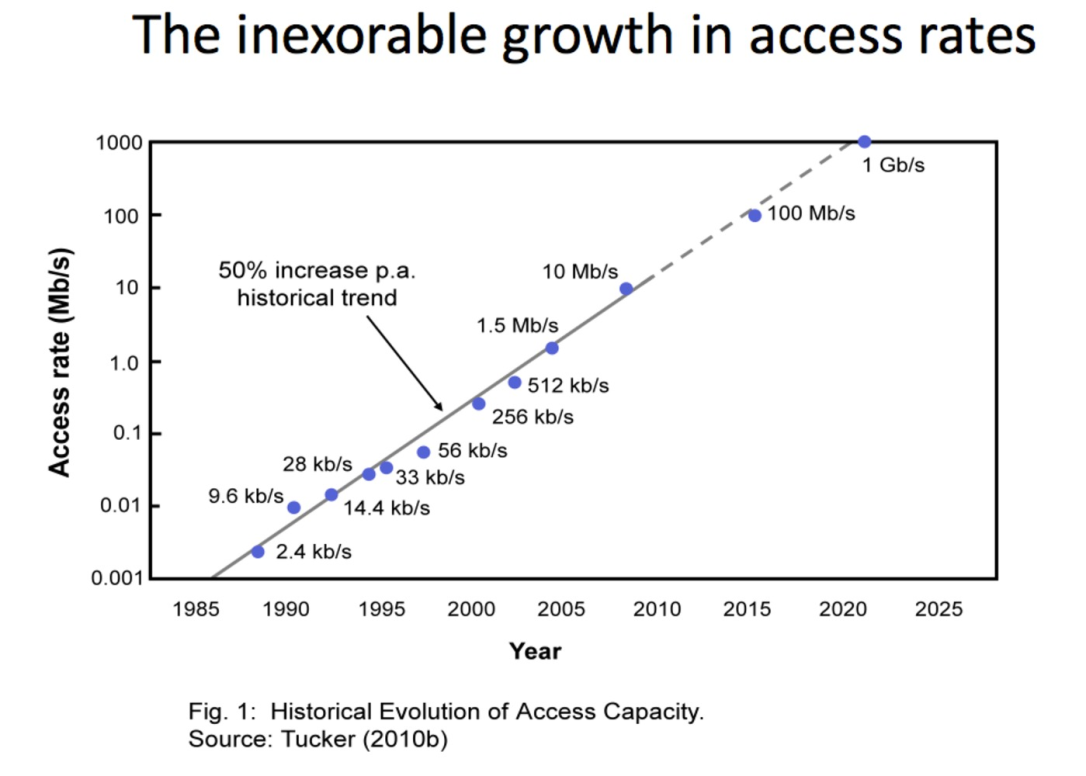
The Nielsen law network connection speeds for high-end home users would double every 21 months
The Metclaff law” states that the value of a telecommunications network is proportional to the square of the number of connected users of the system (n2″). that means when there is 10 user of the system or network it means 100 unique connections by adding 1 user from 10 to 11, the numbers of unique connections increases by 21%. That is foundation of what in the tech industry people call “network effect”. By adding a new users you are increasing exponentially the value of the network. Now imagine in the scale of Facebook, Amazon of Ali Baba.
The Marshall law claims “supply and demand is an economic model of price determination in a market”. It means if you go to the superstore nearby and buy one box of cereal it might cost you $3. There is deal offered by the store, you buy 2 cereal boxes at $5, the cost per boxes could be $2.5. So by increasing the quantity I am ready to buy (demand), the superstore is willing to decrease the price per box (supply).
After reading the 4 laws, you might guess where I am getting at ;).
As the computing power (Mhz) and bandwidth increase (4-5G, Fiber…) by 60% and 50% annually, the devices offering increases. As we are in a competitive market (except North Korea), the quantity of devices outpace the demand (you, me and all consumers) that pushes the device manufacturers to differentiate by increasing the value (more features at same price) and/or decrease prices to match consumer expectations and willingness to pay. Devices manufacturers are able to do that because the connection costs are failing as well. In fact if you connect 10 devices or 10 millions to the same telecom operator network, the connection cost per devices (ARPU) will be dramatically lower.
Lately, consumers buy the devices and is now connected to a global system where all devices are linked each other increasing the value of the network (think internet, mobile phones, social networks and IoT).
Here is my 2 cents in explaining the IoT market boom.
Let me introduce you LEA. if you mix the Web, TV and Cinema, you got LEA.
LEA™ is a user-centric, cloud-based software video solution for Pay-tv operators and MSOs to deploy an immerse, personalized & unified multi-screen experience.
The solution is an OTT plug-in accelerator for faster, easier and more scalable deployment into an operator’s existing video infrastructure.”
Like in this Kill Bill memorable fighting scene, you may already know who is going to win. Now, imagine in a video OTT remake, who is interpreting Uma Thurman, Telcos or GAFAs? Not that obvious, as you’ll discover in this post.
As described in a previous article “Video OTT Market Explained”, there is a clear interest in the $74,1 Bn (source: eMarketer, Luma, 2017 forecast) video OTT ad market, and a convergence is underway with on one side GAFAs getting content and Telcos technology capabilities on the other.
I focus in this post on how telcos can strengthen their position in the video OTT market after analyzing briefly Google, AppleTV and Amazon fireTV video business model.
Google, Apple and Amazon video OTT business model
Basically, platforms are composed of multiple players acting in specific places. As an analogy, you might think of a market hall selling vegetables where you got on one side supply with producers/wholesalers/peasants and on the other demand with buyers. Well, in the digital world, it is the same logic where you got supply with apps developers, creators, OEMs, advertisers… and on the opposite, demand with users. In a market hall they will exchange money on stalls whereas in digital mode, they do it most of the time on appstores/marketplaces with digital money (credit cards, virtual money, bitcoin…).
To dig more on platforms, I strongly recommend to visit the blog from Sangeet Paul Choudary and read the platform manifesto slide deck.
Now, let’s look at the business model of the Apple, Google and Amazon TV offerings; Apple TV, Android TV and Amazon fireTV.
Apple TV and Platform System overview
Android TV and Platform System overview
Amazon FireTV and Platform System overview
AppleTV, Amazon fireTV and Android TV video services are single platforms which belong to a wider platform systems which make very hard for telcos TV/video products and services to compete.
While Apple and Google platforms mechanics look familiar, the Amazon one is different kind. Let’s have a closer look.
Apple and Google: Platforms system to provide digital content as core value exchanges/experiences.
Started from smartphones, Android TV and Apple TV are edge platforms built from greater platform systems. On the producer side,Google’s Android Studio and Apple’s Xcode offer full suit of developer tools and services that allow to leverage their myriad services (i.e. maps, analytics, ads…), assets (i.e. material design, devices, tvOS and Android TV OS) in the form of libraries and API calls bundled in a native SDK. Both tech giants have expanded their platform system to cover different devices in order to offer fully coherent, comprehensive and consistent ecosystem to developers, marketers and advertisers but also a frictionless user experience (UX) to their users/audience (pull, capture, match virtuous UX circle).
Both tech firms follow an envelop strategy (@PlatRevolution from Parker, Van Alstyne and Choudary, MIT Media labs, 2016) to compete against incumbents’ single product and/or platforms to increase traffic and digital content exchange on their respective platform. It avoids multihoming by increasing user’s platform switching costs (i.e. as an iphone user, you may have acquired many apps and content that can’t be played on Android and vice versa).
Ignite a video platform is really hard, Google video and Brightcove started as a C2C platforms but failed against Youtube. Brightcove has pivoted and offer now B2B platforms for premium video content publishers while Google acquired Youtube.
Amazon: Platforms system to provide ecommerce and services as core value exchanges
Amazon core value exchange remains amazon.com. All services and products that Amazon launches is aimed to increase the site traffic, conversion rate, basket value and customer retention. Amazon Web Service was no different. AWS primarily objective was to offer a better infrastructure to amazon.com scaling engineering challenges. Still, AWS first customer remains amazon.com. Amazon has then developed edge paltforms like FireTV, Kindle, Dash, Alexa, on top of the amazon.com that acts as the platform system’s centre of gravity.
Think Amazon edge platforms as group of specialized e-retailer:
Retail clubs and loyalty customer rewards => Amazon Prime Services
Book shop => Kindle Reader and apps
Brochures and papers => kindle tablet, silk browser.
Video rental => FireTV
Music shop => Amazon music
Shopping assistant => Alexa
Order to delivery =>Dash
etc…
Why platform system beats today’s single platform
GAFA and internet players enjoy 5 key advantages over telcos:
– Network Effect (i.e. metclaff law) – Scale at marginal zero cost (inventories, resources etc.) – Massive existing eco-system (developers, users, partners…) – Massive Data (Google and Facebook have the biggest first party data globally and Amazon the biggest shopping customer data) – User stickyness (high rate of DAU and MAU on firms’ services)
Platform systems (Ps) > TV platforms (Pt) > product/service (p) Ps > Pt > p
Telcos challenges
Telcos around the world face major challenges as illustrated below:
Telco 10 challenges
However, in this gloomy picture lies 12 reasons to believe:
Authenticated audience (TV/Video paid subscriber services) consumes more video content than non authenticated. In addition, users are more engaged with 2,3X more ad views on long form (>20min) content. (source: Freewheel VMR, Q1 2016)
Content exclusivity: mainly dramas, sports and other premium tv programs still attract the bulk of advertisers
Pricing power: telcos enjoy big TV/Video price cost advantage with bundles and pricing choices
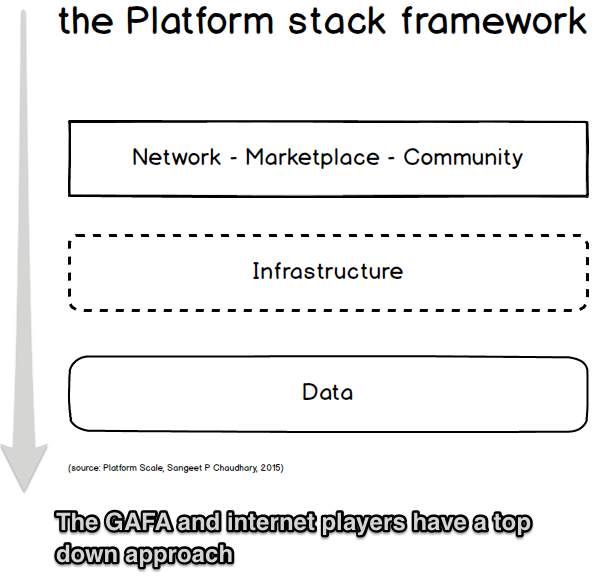
Network — Marketplace and Community: this is where the interactions between producers and user are performed (pull, facilitate, match exchanges as shown in Amazon tv, Android TV and AppleTV single platform above)
Infrastructure: those are technologies that support the main valued interactions (i.e. AWS, data centres…),
Data: enabling data collection, insights and monetization (for more info on OTT Data monetization, please check this post).
The GAFA and Internet players generally tend to adopt a top down approach.
Considering Telcos assets, unlike GAFA and internet players, they should go bottom-up
In the TV/Video platform case:
Network — Marketplace and Community = UX delivery pipeline (UX logic including interfaces and meta-data mainly)
Infrastructure = Video distribution pipeline (video transforming processes from head end capture, encode/transcoding, drm, to video player)
Data: Video Tools and Services enabling the full management of first, second and third party data (i.e. advertising, search, network PVR services)
Platform stack framework adapted to TV/Video platfoms
Telcos weakness is the Network — Marketplace — community or UX distribution pipeline
Transforming the TV/Video service with a simplicity big bang articulated around 6 key elements: Multi-screen UX, Unified search, Unified content and aggregation, Personalised and smart curation, Content richness and finally be really Social.
Well, according to analysts (Luma, Forrester researches, Parks Associates), my observation, discussing with Telcos, UX researches and testing, the ingredients to propose a frictionless valuable interaction could be articulated around 6 key elements:
Multi-screen user UX: A user should be able to watch content on any screen, anywhere, either online or offline.
Unified search: Apple TV, Android TV and Comcast have taken steps to resolve this issue, but it is still clunky. It should be as easy as googling.
Unified content and aggregation: Users should be able to access content from ALL video content either live or not, labelled (hulu, netflix, amazon prime video…), or user generated (youtube, youku, viki…) or user generated broadcasted (periscope, facebook live…).
Personalised and smart curation: A lot of researches have shown that large choices lead to user frustration. Here is a great TED talk from researcher Barry Schwartz on the subject. He calls it the “paradox of choice”.
Netflix have shown the way, either on their recommendation portal or playlist to provide smart curation and editorial system. Yet, it is still limited and nascent.
Content richness: Users should be able to watch whatever content s/he wants on any format (mobile, TV, tablets…) just like Amazon has done for books.
Social: Humans are social species by nature. Communication is a basic need. Users should be able to share videos, regardless of their types on any platforms. Blockchain can help here. It is happening on the music industry with firms like Revelator, PeerTrack or open source Muse project allowing music creators to distribute content directly on any platforms and monetize through pico/micropayments. I think it is a matter of time in the video OTT market.
The Video OTT market is far from being closed. Opportunities are out there, telcos can be the Uma Thurman of video OTT market but will require a lot of kung-fu training until reaching mastery.
Any additional comment or observation about platforms, OTT, UX, disruptive business model, please let me know. Reach me on Zishan Mohammad.
Through discussions with operators, partners and stakeholders, one million dollar question surfaces all the time: “how telecom operators can monetize OTT generated data”.
Well, before exploring OTT data dynamics, telecom operators need to understand that they play in a multisided platform ecosystem and economy. Pure transactional businesses are vanishing rapidly, whether operators like it or not, they play more and more in an interaction business.
We are not in the business of building software, we are in the business of enabling interactions (Platform Scale by Sangeet P. Choudary)
What it means is the fact that Telecom operators entering the OTT platforms must create valued interactions/exchanges by intermediating providers of digital content (music, video…) and audiences. It is only by enabling interactions that unlock valuable exchanges with positive externalities that users will adopt, stick and nurture in OTT platforms. I will discuss the what platform economics mean for OTT in a later post.
Then, once the OTT platform interaction design is set, it is important for operators to understand the underlying data flows. The figure below is an illustration of a typical OTT Platform programmatic monetization data flow
figure 1: OTT platform monetization — data flow
Operators collect large amount of first party data (declared data like CRM, usage, behavioural, browsing, search, purchase, geo…) and can leverage second party (other firms first party data) and third party data (mainly inferred data indicating contexts, moods, emotional footprints using AdID, semantic and other techniques) to picture audience customer journeys, interests and many other parameters.
These audience insights will be key to make the OTT platform valuable to media buyers and brands.
Secondly, the audience monetization is composed basically of 3 actors:
The demand side: you got Media buyers, Agencies and DSP
The supply side: you got publishers like OTT platforms providers and SSPs.
Platform intermediators side: Ad Exchange platforms providers, DMP and other related data providers
As illustrated in Figure 2 below, for €100 Ad budget (according to IAB), roughly:
30% goes for the demand side: 20% for Agencies + 10% for DSPs
40% goes for the supply side: 40% for the publishers
30% left for Platform intermediators: 25% for Data providers and 5% for the Ad Exchange platform
It is worth to note that OTT Platforms providers collect funds from audience directly for access and services through 3 methods:
Indirectly: the audience is the currency (AVOD, freemium and other ad sponsored services)
Directly: the audience pays for platform access & services (Transactional or subscription for example)
Hybrid: mixing indirect and direct
figure 2: OTT Platform monetization — money flow
Telecom operators’ OTT platforms have an advantage compared to pure internet players (Amazon fire TV, Apple TV…) and content distributors/aggregators (i.e. HBO, Netflix…) because they have already an audience and collect much more data through devices (Phones, STB…), network signal processing (OSS…), support (help desks, retail…) and first party data (CRM, BSS…). This explains partly why pure internet and content players want to own the billing relationship with the users (i.e. Netflix) and/or the platform monetization ecosystem (i.e. Roku, Apple TV),
Let’s take Roku as an example. The firm proposes a complete end to end video OTT experience platform to users (demand side) and tools/services (sdk, framework with brightscript, design guidelines, billing/settlement system, ad exchange) to content producers/channels /developers (supply). Roku then enjoys an enviable situation where it acts as the gatekeeper between all data flows between users and producers. For every billing transaction, Roku takes 20%. the firm may monetize as well its audience data by selling it (i.e. first party data) to advertisers (i.e. Viacom, WPP…), brands (i.e. P&G, Unilever, L’Oréal), broadcasters, content producers/studios, audience measurement (i.e. AC Nielsen, Kantar Media…) and 3rd data providers (i.e. Acxiom, Krux, Oracle Blukai…). The true value of Roku is in the platform ecosystem and interactions it generates rather than the set top box or retail presence. Those access point are just ways to reach users. It would be interesting to analyse Roku’s D/MAU, CVR, CTR, adoption, download rates, impression, GRP, CPC/M, Ad inventory fulfilment and other KPIs and compare it to Amazon Fire TV or Apple TV.
To successfully monetize OTT platforms, telecom operators have to shift gear from transactional to platform economy, then design a well-taught interaction system and data flows, capture data and finally monetize it. As a multisided platform, it is crucial to propose high interaction value that attract (i.e. pricing, content offer…), facilitate exchanges (i.e. frictionless cross device UX…) and match users (demand side) with advertisers (supply side).
Some useful reading for anyone to dig programmatic Ad
DSP: Demand Side Platform: Technology used to purchase advertising in an automated way. It allows advertisers and agencies to manage online media campaigns by facilitating the buying of auction-based media, including; display, mobile, video, social, and native as well as audience data across multiple inventory and data suppliers in a centralized management platform. (source: IAB)
SSP: Selling Side Platforms: Programmatic advertising technology platform for publishers, which enables them to optimize the monetization of their inventory and maximize yield, whilst protecting their reader experience and consumer data. (source: IAB)
DMP: Data Management Platforms: Combine online behavioral data, socio-demographic data with offline data to create a single, centralized hub of consumer intelligence. With all offline and online data in one place, questions such as the following can be asked: who are the company’s most valuable consumers, and how do they behave in both the digital and physical worlds? With a DMP, instant access to actionable feedback provides a solid basis for testing new strategies and new tactics. The data may paint a picture that confirms intuition; empowering marketers to make further refinements. Or the data may be surprising, leading marketers to take a different course of action. Either way, they know that their insights are based on facts, resulting in new marketing confidence and more decisive action. (Source: IAB)
First party data: CRM data, whether online or offline, from people who have made purchases at physical stores or via an e-commerce site; from sales leads; and from people who have interacted with their call center. Advertisers also have data regarding user behavior on their website and campaign performance data from email, display, video, mobile, direct mail, TV, print, and other media. First party data is often gathered through tag management where small data files are put on each web page or email as a pixel. This pixel tracks user interaction and when synchronized in real-time with the DMP provides a new level of visibility of activity on the site. (source: IAB)
Second party data: Second party data is making use of someone else’s first party data, for example a publisher’s audience data. Second party data enables a marketer to augment their first party data with a new data set, enabling the advertisers to enrich the knowledge about their audience at scale. (source: IAB)
Third Party data: In-house information is important, but its value increases dramatically when blended with audience data from third party providers. With a data management platform, first party data helps to highlight valuable audiences, then third party data can be overlaid to develop an understanding of attributes, behaviours, and content consumption. For example, a DMP can show, from second party data, where visitors engaged or converted, and from third party data helps to illustrate factors such as economics, family position and stage of life (Source: IAB). Main actors in data brokerage space: Acxiom, OpenX, Oracle Bluekai, DataXu.